| www.lfweathercenter.com | HOME |
- Home
- Forecast
- Severe Weather Outlook
- Satellite
- Maps
- Graphs
- Gauges
- Reports
- History
- Links
- About
- Site Map
- Mason MI


Graphs updated every 5 minutes
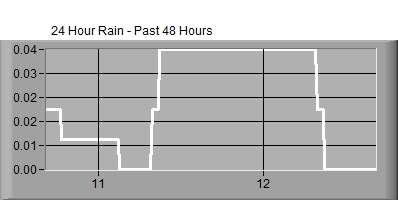
↓ 7 Day Weather History ↓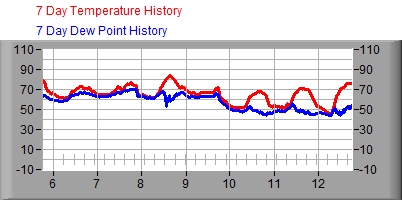  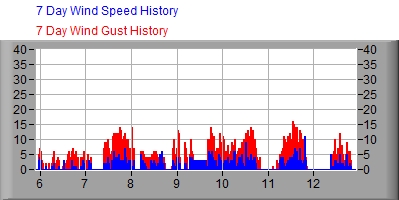 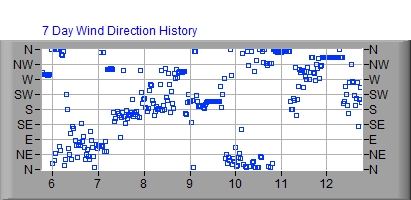 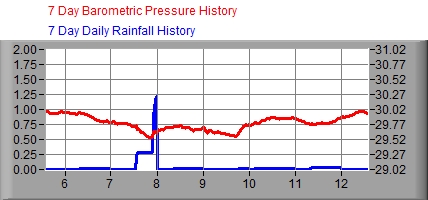 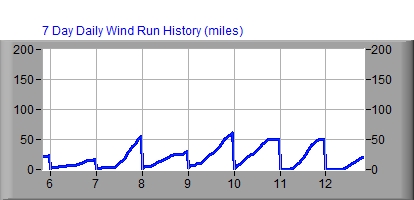
|
↓ 24 Hour Weather History ↓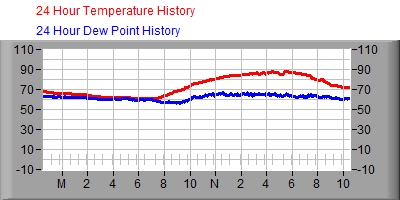  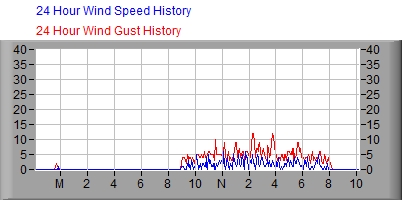 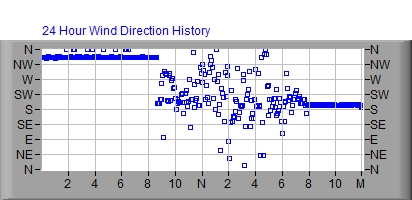 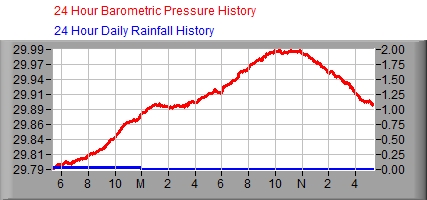 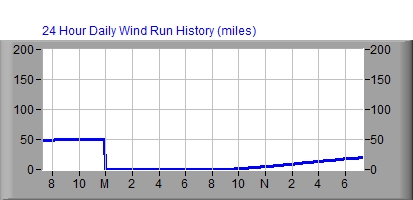
|
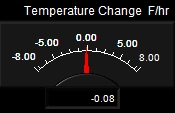
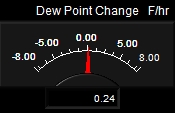
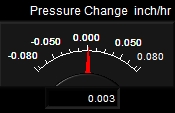
- Current Weather Trends -
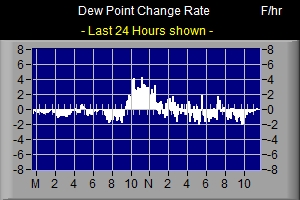
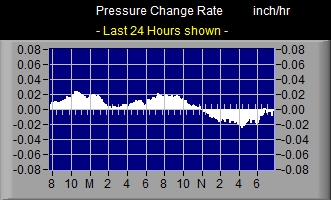
- Weather Trends -
over the past 24 Hours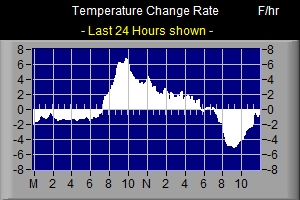
- Running-Total Accumulated Precipitation Graphs -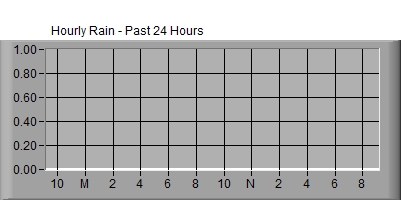
|
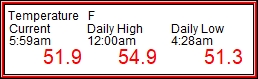
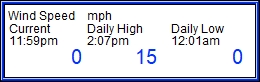
- Today's Weather Summary - |
|
|
|
Never base important decisions on this or
any weather information obtained from the Internet
Updated
Automatically by Ambient Weather's Virtual Weather Station V14.00
Data Collected by Davis Vantage Pro2 Weather Station